5. Graphs
5.1. Current weather data
Data of active sensors is updated and presented on tab page 1. Lowest and highest values for each individual parameter are recorded (since the start of the datataking). The sensor readings are updated every 5 seconds (some Davis sensors require a minimum time interval before a new measurement can be produced. For details, consult the Davis manuals shipped with your weather station). In addition, the ‘GPS time’ is displayed (will only be different from the pc/console time when a cosmic ray set-up with properly functioning GPS antenne is running on the same computer. This GPS time is required to synchronise cosmic ray data and weather station measurements. When running the weather station in ‘stand-alone mode’, please adjust your pc clock to GPS time! The weather station console also provides a weather forecast. Forecasts are based on (at least) 3 hours of recent console data.
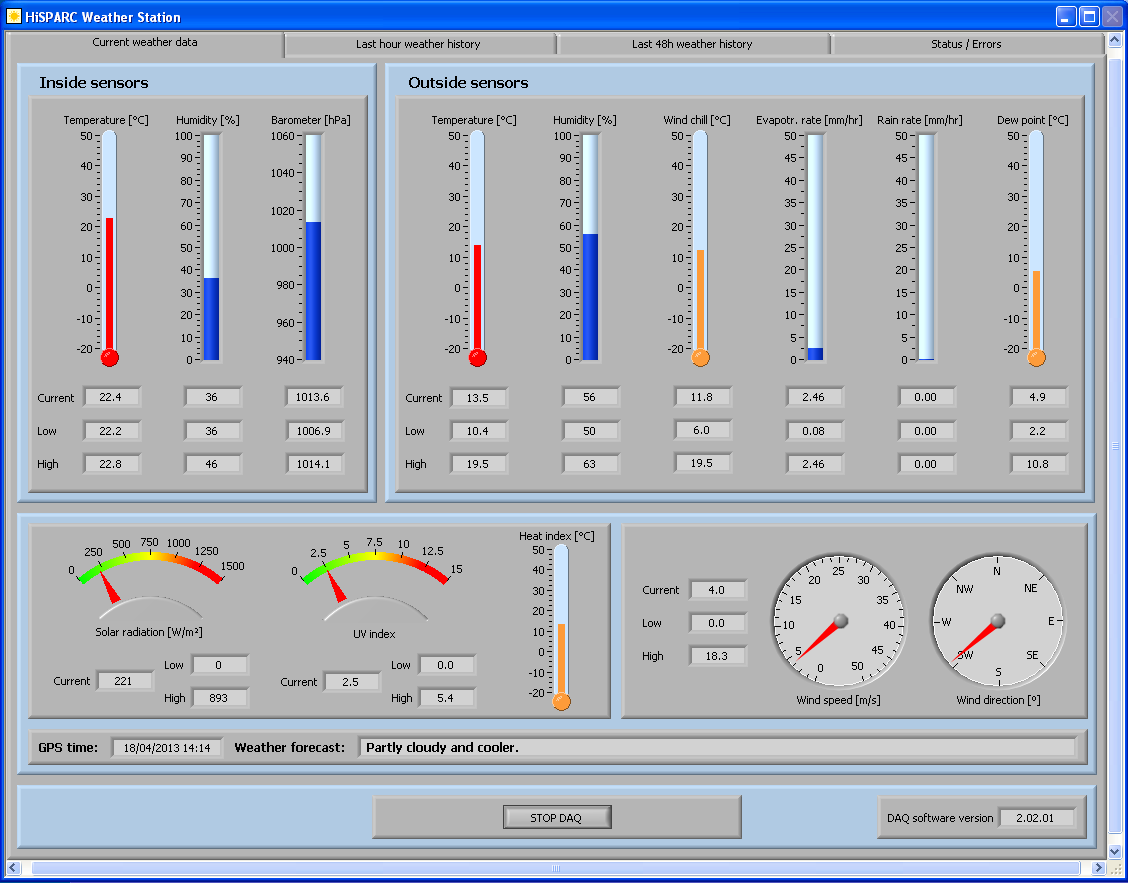
The Current weather data tab (click to enlarge)
5.2. Last hour weather history
Data of active sensors collected over past 60 minutes is presented at a separate tab page.
To limit the number of entries in the plots, 1 minute averages are calculated (this implies that after starting the software it will take 2 minutes to see the first entries in these plots).
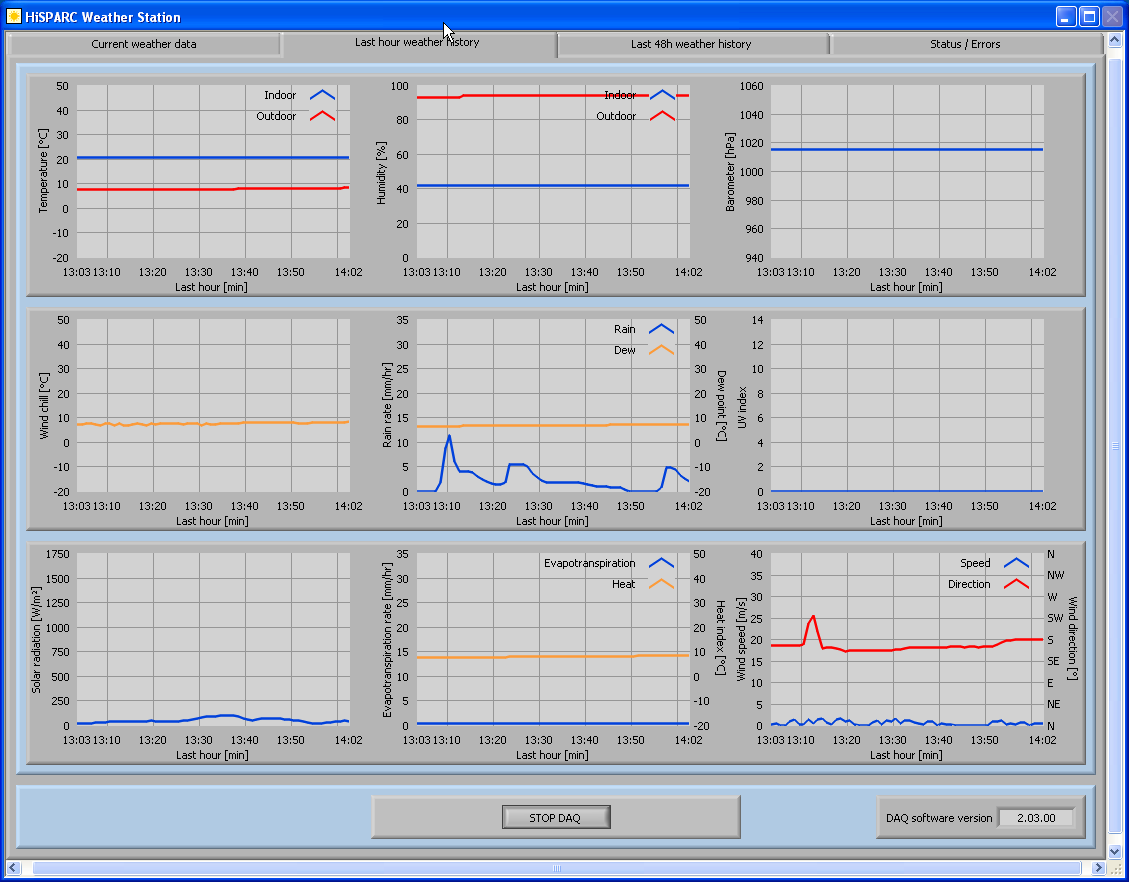
The Last hour weather history tab (click to enlarge)
5.3. Last 48h weather history
Data of active sensors collected over past 48 hours is presented at a separate tab page.
To limit the number of entries in the plots, 10 minute averages are calculated (this implies that after starting the software it will take 20 minutes to see the first entries in these plots).
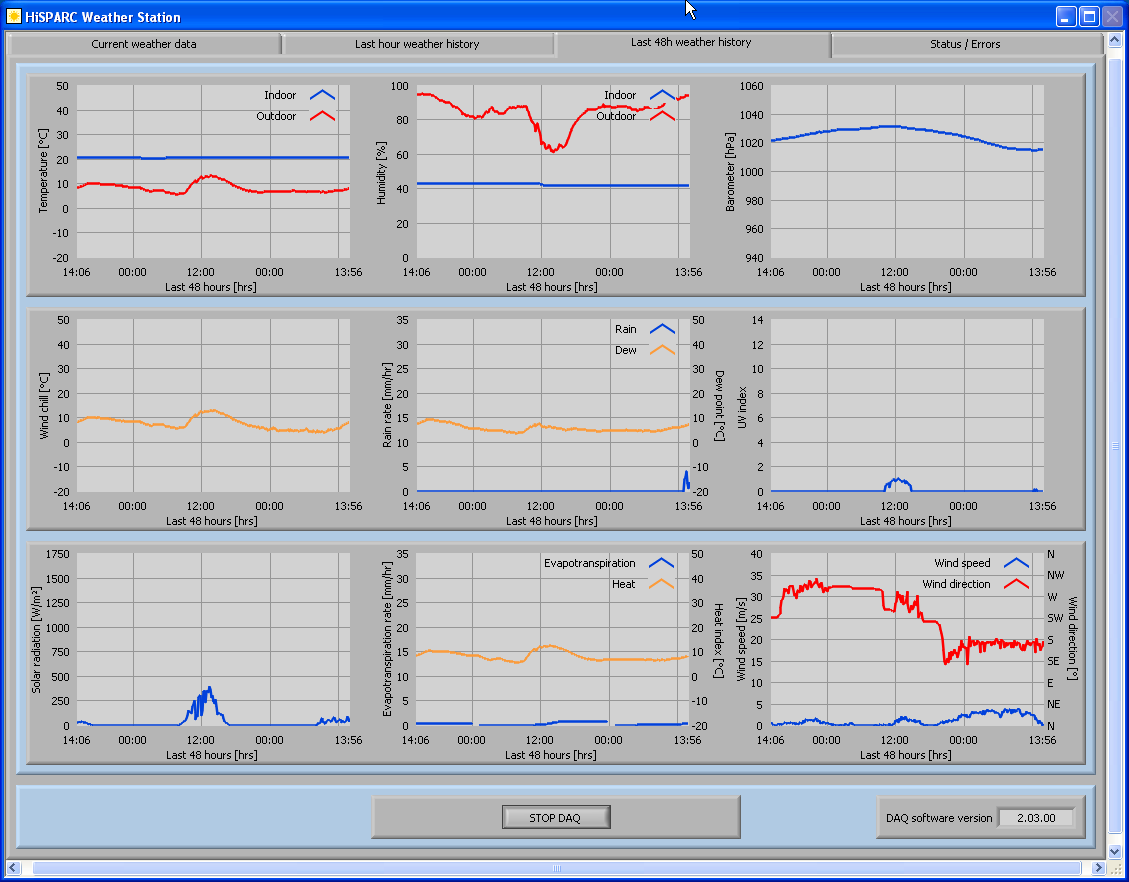
The Last 48h weather history tab (click to enlarge)