Event display
This page describes how the Event display works. With this web application you can see HiSPARC events occuring on a map.

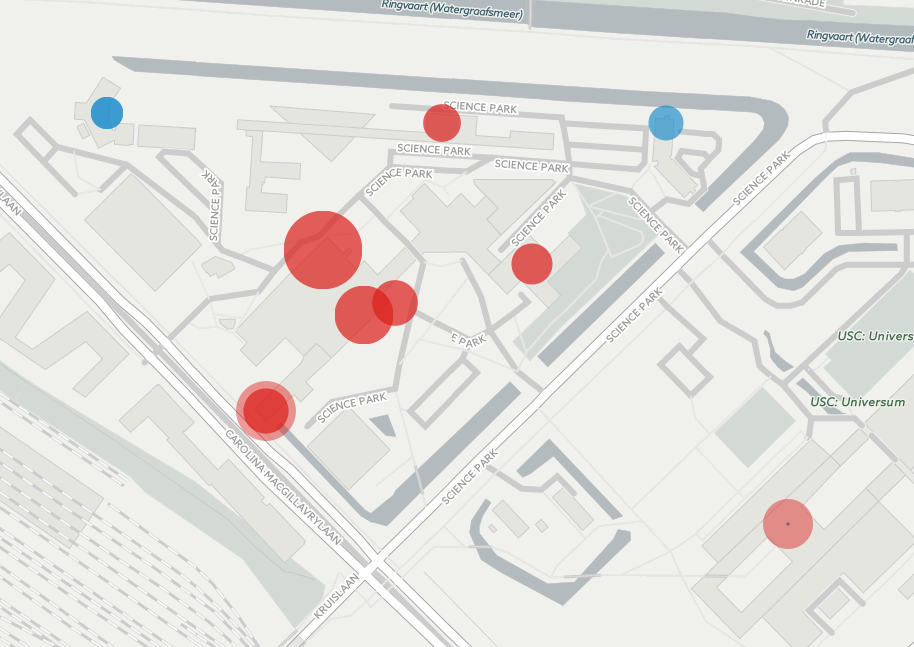
The event display for Science Park.
Markers
The map will show two kinds of markers:
events are air showers detected by a single HiSPARC station
coincidences are air showers detected by multiple HiSPARC stations simultaneously
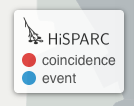
Their respective colors are shown in the legend in the topright.

Marker legend.
Choose cluster
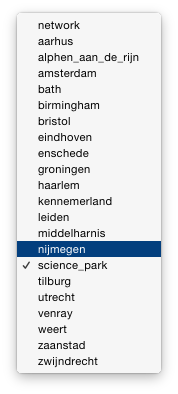
In the bottom right of the page is a dropdown menu from which a subcluster can be selected. Events and coincidences from the chosen subcluster will be shown on the map.
The chosen subcluster will be set as the location hash of the page. So
if Amsterdam is chosen the url ends in #amsterdam. If the page is
loaded without a hash it will default to the Science Park cluster,
automatically setting the hash to that value.

Menu to choose the cluster.
JSON data
The page works by loading pregenerated JSON data.
First a station JSON is loaded. This contains a list of stations and their locations, and the start and end timestamps of the dataset. The start and end timestamps are used to align the individual events and coincidences.
Then a JSON with a list of events is loaded for each of these stations. For each event the exact timestamp and number of particles is given. The timestamps are used to playback the events in real-time, since the time between consecutive events is known. The number of particles is used to determine the size of the marker.
Finally a JSON with coincidences between the stations is loaded. This contains similar data like the event JSONs, but then for each shower the number of particles for each participating station.
In the source code the Python script that creates the JSONs can be found. The JSON data is loaded with relative paths, so if ran locally you can supply your own data.
Note
If you want to use Chrome when running this page locally it needs to be
started with the --allow-file-access-from-files option.
