jSparc analysis
This page describes the functions of the jSparc analysis web application. With this web application you can analyse air showers detected by multiple HiSPARC stations.
Here is a step by step guide for the functions of the page.
Get data
The page will be quite empty at first and only show the HiSPARC logo and a form where you can enter the session title and pin and your name. The title and pin can be obtained by you or your teacher by requesting an analysis session, which can be done on the Session Request Form. Once you have filled in this information you can press the Get data button to load the data. If you do not have a session you can still use this web application by pressing the Get example button.

Form where you can either get data from a specific session or an example event.
Traces
Traces are the signals that the photomultiplier tubes of each detector measured during the event.
Coincidence traces
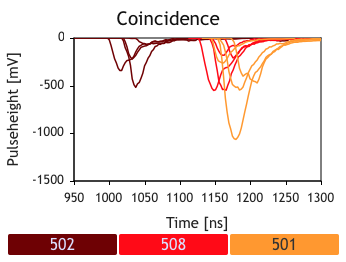
The traces for all detectors for all stations that participated in this coincidence will be shown in the top graph. Underneath the graph are bars that indicate which color the traces for each station are. The x-axis is the time in nanoseconds since the start of the event. The y-axis is the strength of the signal in the detector, which is a measure for the number of particles going through the detector.

Traces for all detectors (same color) for each station (different colors) in the coincidence.
Station traces
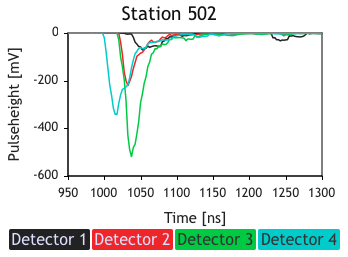
Below the Coincidence graph you can view the traces for each station separately. You can select a station by clicking the station numbers under the coincidence graph.

Traces for all detectors (different colors) for a single station.
Zooming
You can zoom in on the traces in these graphs by selecting an area of the graph with your cursor. To reset the zoom to the full graph, double-click somewhere in the graph.

Traces for all detectors (different colors) for a single station.
Map
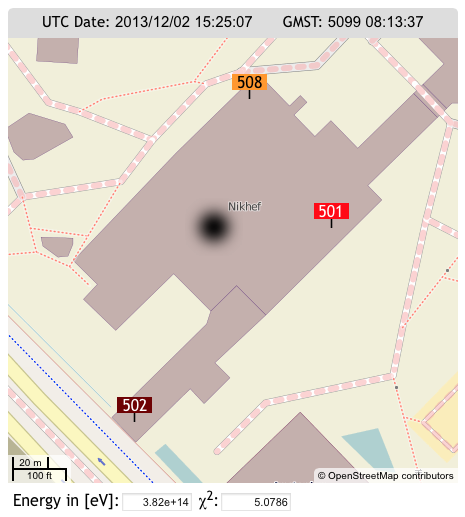
The next area is the map, this shows the locations of the HiSPARC stations that participate in the coincidence. The background map is loaded from OpenStreetMap, the map can be repositioned, and zoomed in and out by scrolling.

OpenStreetMap showing the locations of the HiSPARC stations and the chosen shower core position.
Shower core position
You will also see a black blob in the middle of the map, this represents the shower core. The goal of the analysis is to find the location of the shower core by trying to find the location that best explains the signals detected in the stations. The shower core can be dragged around the map. When the core is dragged around the map you can see that numbers around the map start to change. For instance, underneath the map is the chi-squared value that tells you how well the proposed location of the shower core matches the detected signales. The higher the chi-squared, the worse the fit, so try to get it as low as possible.
Data tables
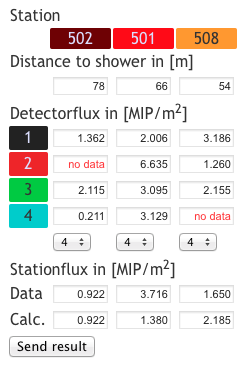
On the right side of the page you can see the current distance of the shower core to each station (columns), the strength of the detected signals for each detector (rows) and the average station signal strength from the data and the expected signal strength from the chosen location of the shower core. The detected and expected signals should match as closely as possible. The better these match, the lower the chi-squared will be.

Overview of detector data.
Submit results
One you have finished analyzing your coincidence you can submit you results (results from example coincidences will not be stored). You can submit you results by pressing the Send result button under the data table on the left.
